Solid Woods Sales
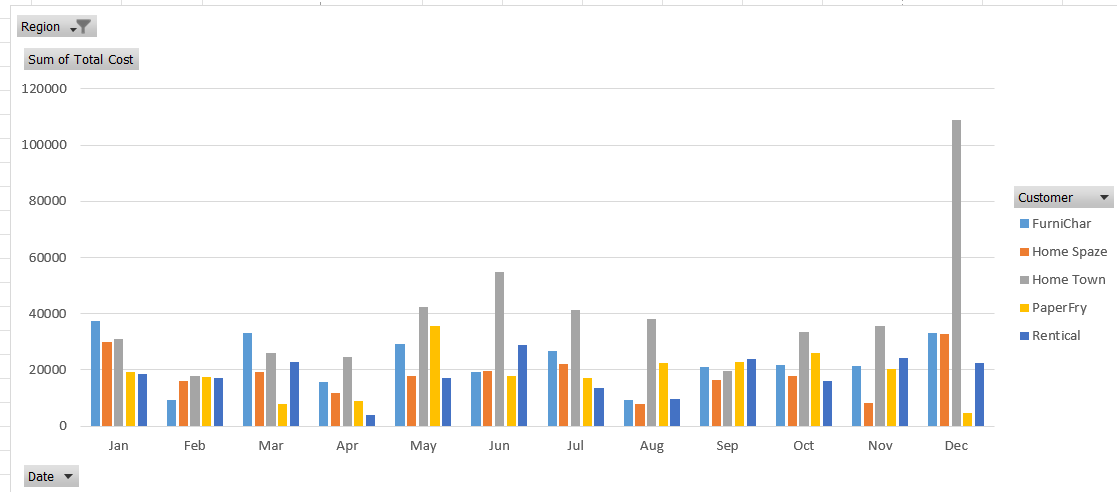

This project involves an Excel file containing Solid Wood Works Furniture sales data. The file includes around 1,000 columns detailing each product sold, salesperson, region, customer date, item cost, number of items, and total cost. I created a Pivot Table and Pivot Chart to display key performance indicators (KPIs) for each month, showing the total cost sum for each vendor per month and the grand total spent.
View Visualization Source Code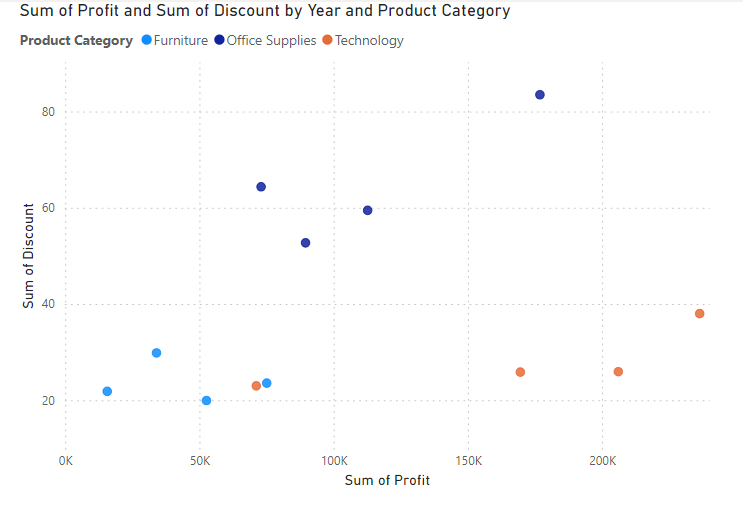
In this project, I worked with a dataset containing approximately 9,000 rows, which included details such as discount, unit price, shipping cost, ship date, and more. Utilizing Power BI, I created several visualizations to provide insights into the data. Bar Chart: Displays the sum of sales and sum of tax by region. Line and Stacked Column Chart: Shows the sum of profit and sum of discount by customer segment, illustrating the relationship between these metrics. Scatter Chart: Highlights the sum of profit and sum of discount by year and product category, allowing for analysis of trends over time and across different product lines. These visualizations effectively communicate key performance indicators and trends, providing valuable insights for decision-making.
Source Code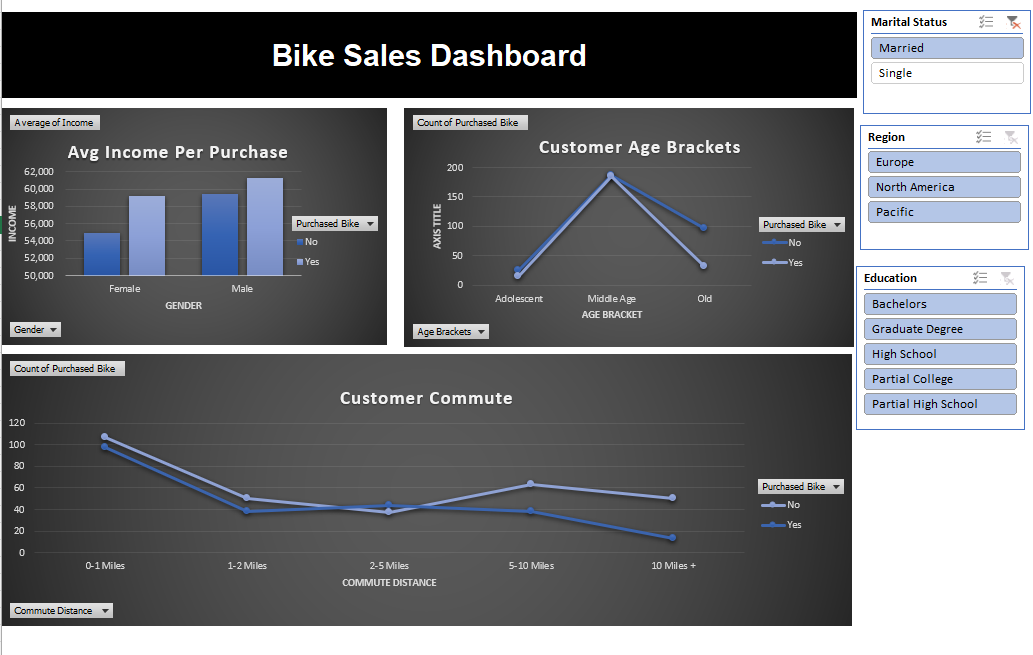
In this project, I cleaned and standardized the dataset by removing duplicates and converting marital status abbreviations to full names. I also created an "Age Brackets" column to categorize customers. To visualize the data, I developed PivotCharts and PivotTables, which included bar charts for average income per purchase and line graphs for customer age brackets and commute distances. My analysis revealed that single, middle-aged consumers with commutes of 0-1 miles and incomes over $52,000 are the most likely to purchase bikes. Additionally, I implemented slicers to filter data by region, marital status, and education, which enhanced the depth and usability of the analysis.
Source Code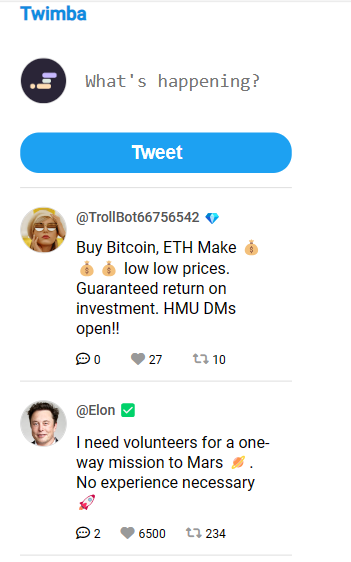
Presenting Twimba, a Twitter clone offering features like liking, retweeting, and tweeting! This project brought immense joy and became my favorite endeavor.Developing a Twitter clone as a front-end developer has presented several challenges, including ensuring responsive design for diverse devices, implementing real-time updates seamlessly, and managing secure authentication and authorization processes. Optimizing performance, addressing cross-browser compatibility, and prioritizing accessibility are ongoing concerns. Additionally, maintaining UI/UX design consistency, handling large datasets efficiently, and ensuring robust security practices have been crucial.
Live Website Source Code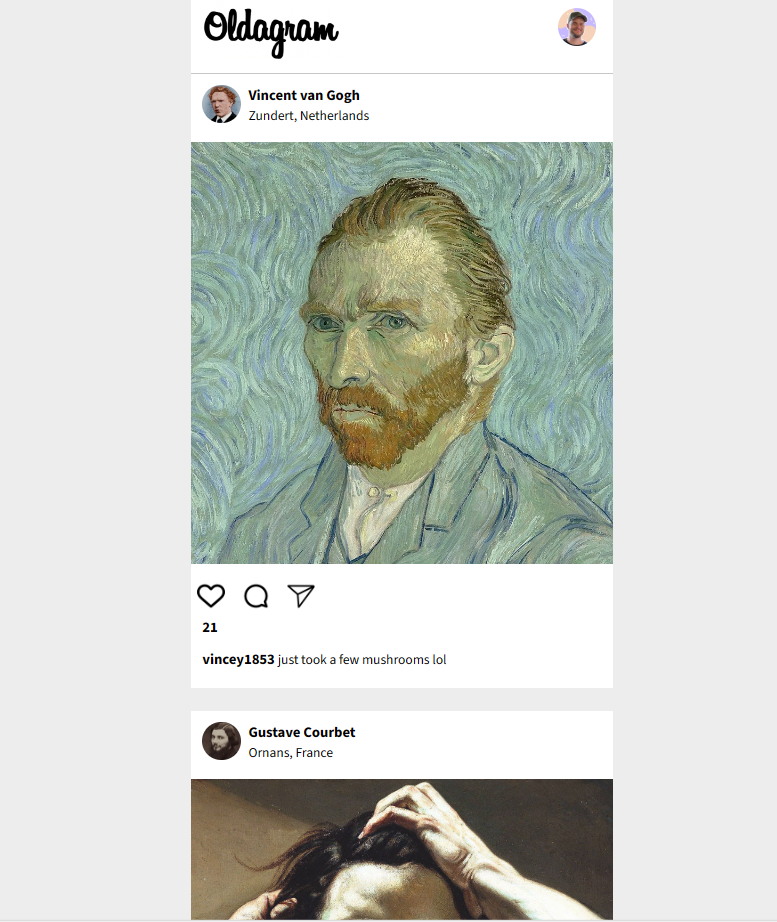
For my individual project on Scrimba, I had the exciting challenge of developing an Instagram replica, and thus, Oldagram was born. This Instagram clone showcases humorous posts from renowned artists like Vincent van Gogh and Gustave Courbet. Users can interact by double-clicking on a post or using the heart icon to increase or decrease the number of likes. Upon delving into the code, you'll discover semantic HTML and data rendered dynamically using JavaScript.
Live Website Source Code
Introducing WanderLust Compass, a captivating landing page built on React.js. This website harnesses the power of React by incorporating Props, Components, State, and render, providing users with a seamless and efficient browsing experience, resulting in significantly faster loading times compared to traditional JavaScript implementations. Immerse yourself in the world of WanderLust Compass and enjoy a visually stunning interface coupled with advanced functionality, all crafted with the latest in web development technologies. Embark on a journey of exploration with a website that not only looks great but also delivers optimal performance.
Live Website Source Code
Scrimba Solo project was to create a meme generator using HTML, CSS, and React. I start by crafting the user interface using HTML and CSS, making sure it's user-friendly and visually appealing, with features for uploading images and adding text captions. React comes into play for the dynamic functionality. I set up state management to handle user input and image rendering. Implementing image manipulation, like resizing and text positioning, is a key part of the process. I also focus on error handling for image uploads and real-time previews. Once the meme is generated, I provide options for users to save or share it. This project requires a strong grasp of React components, state management, CSS for styling, and the integration of user interactions to create an engaging and interactive meme generator.
Live Website Source Code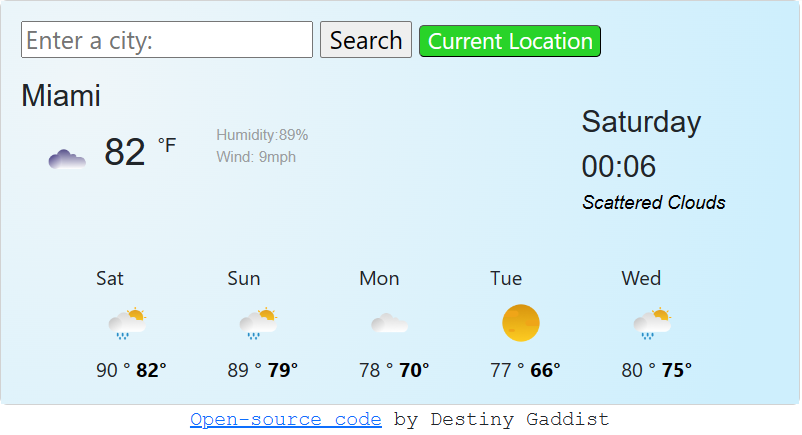
For my SheCodes bootcamp final project, I had the task of building a weather app with my newly acquired knowledge of HTML, CSS, and JavaScript. Throughout this project, I encountered several challenges, including the unavailability of the OpenWeatherAPI, which forced me to switch to a different API, and I also encountered numerous bugs along the way. The pressure to meet project deadlines added to the complexity. Additionally, I had to find the right balance between responsive design and performance optimization. Despite these hurdles, I successfully completed the app, which features a "current location" button providing a 7-day weather forecast and a search function for accurate weather data for various cities.
Live Website Source Code